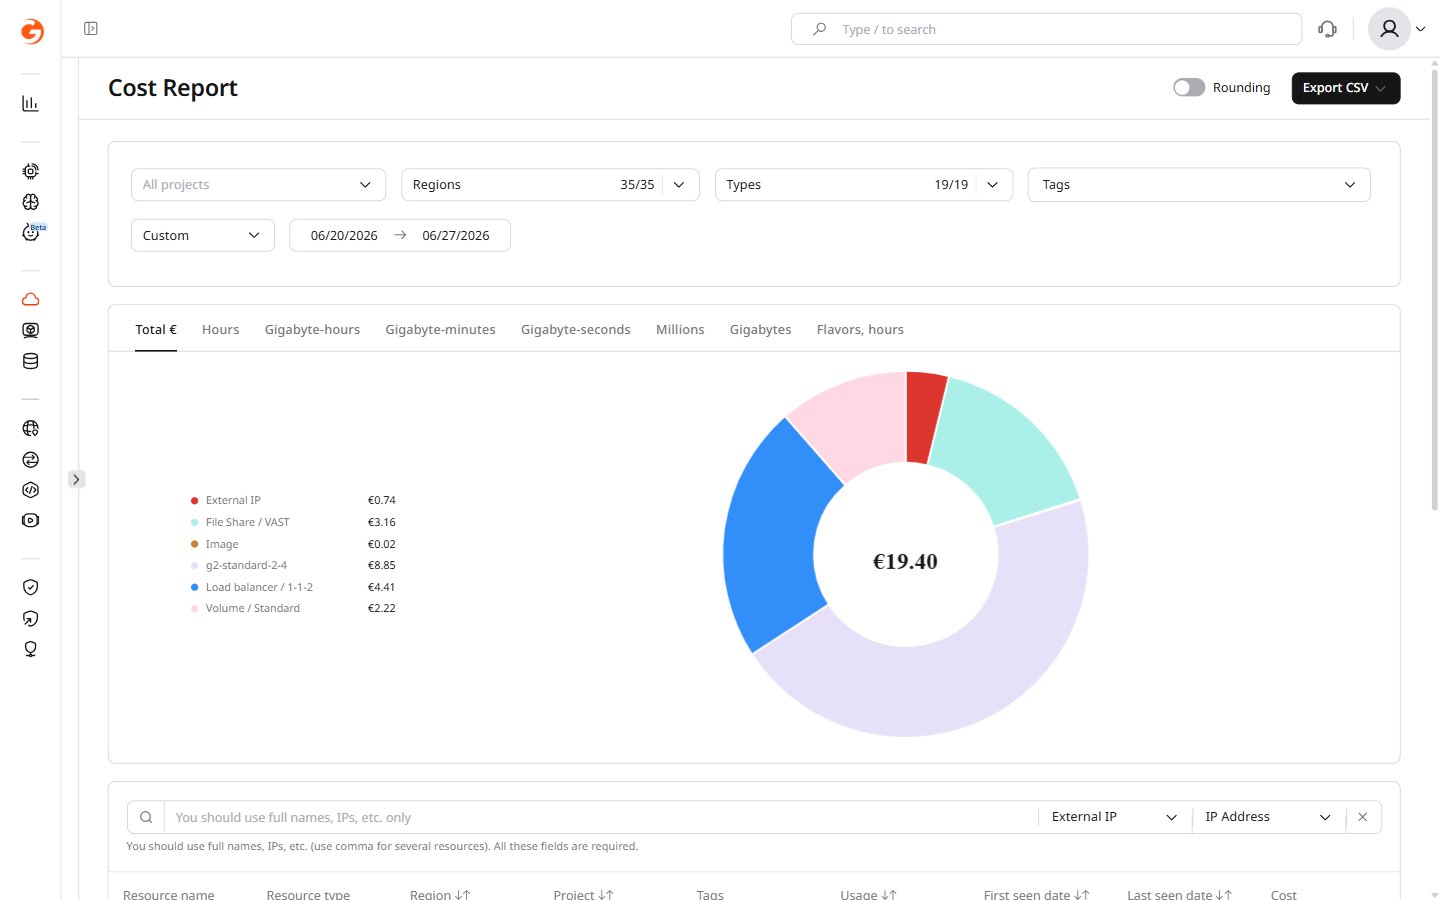
- Cost Report — costs for all Cloud resources used, calculated at Pay-As-You-Go rates. If active resource commitments exist, the prices shown don’t reflect actual costs because commit discounts are not applied.
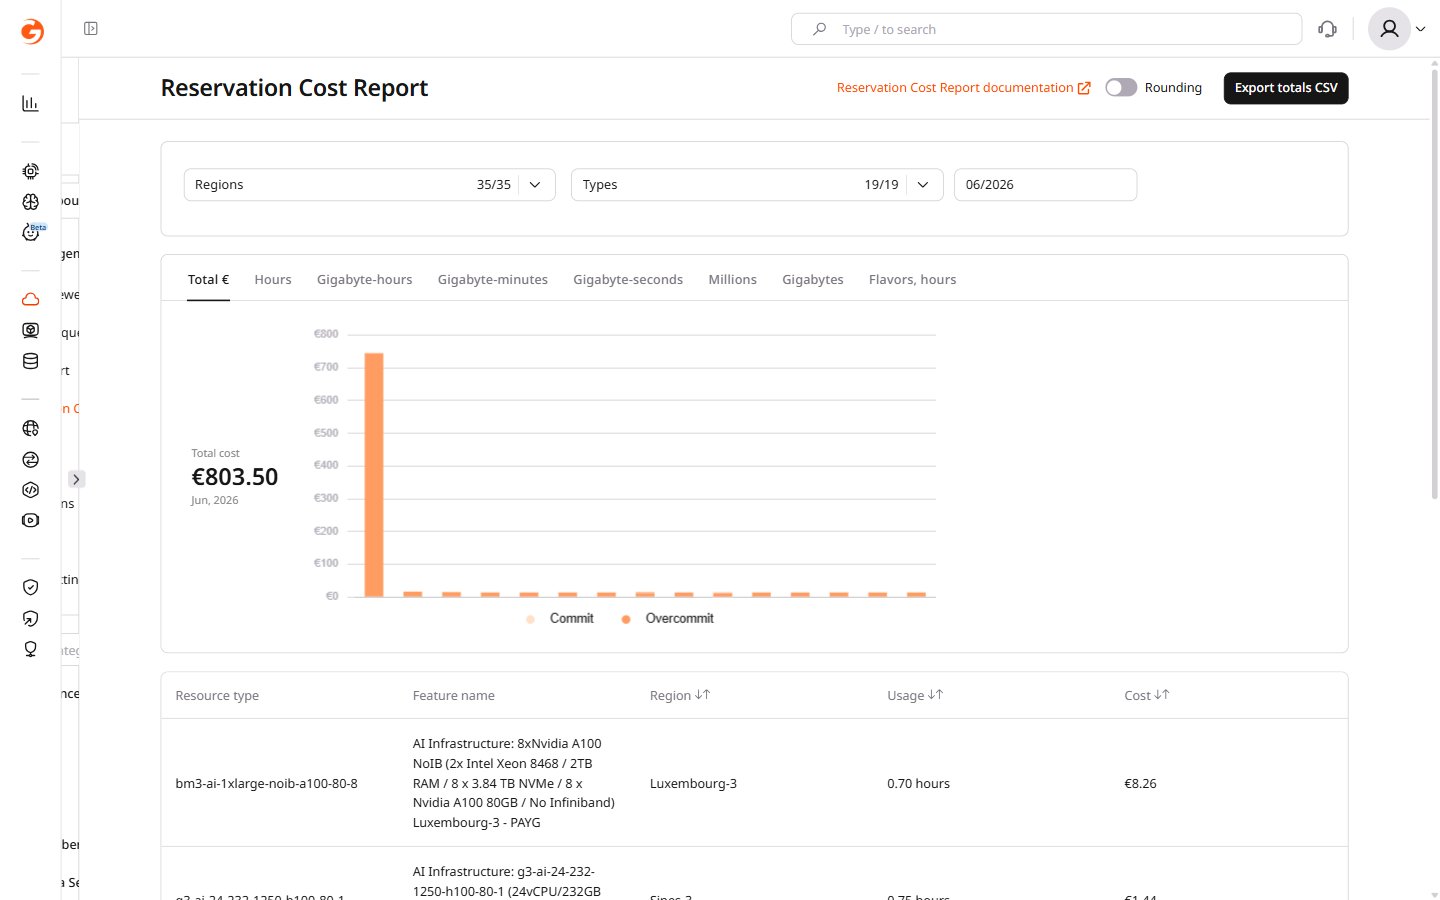
- Reservation Cost Report — monthly resource usage and costs that account for resource commitments. This report shows how much of the committed resources were consumed, whether commits were fully utilized, and any overcommit costs incurred when usage exceeded the reserved amount.
Cost Report
This report calculates all costs using Pay-As-You-Go rates and doesn’t account for resource commitments. If active commits exist, the prices shown won’t reflect actual costs. Check the Reservation Cost Report for cost data that includes commit discounts.
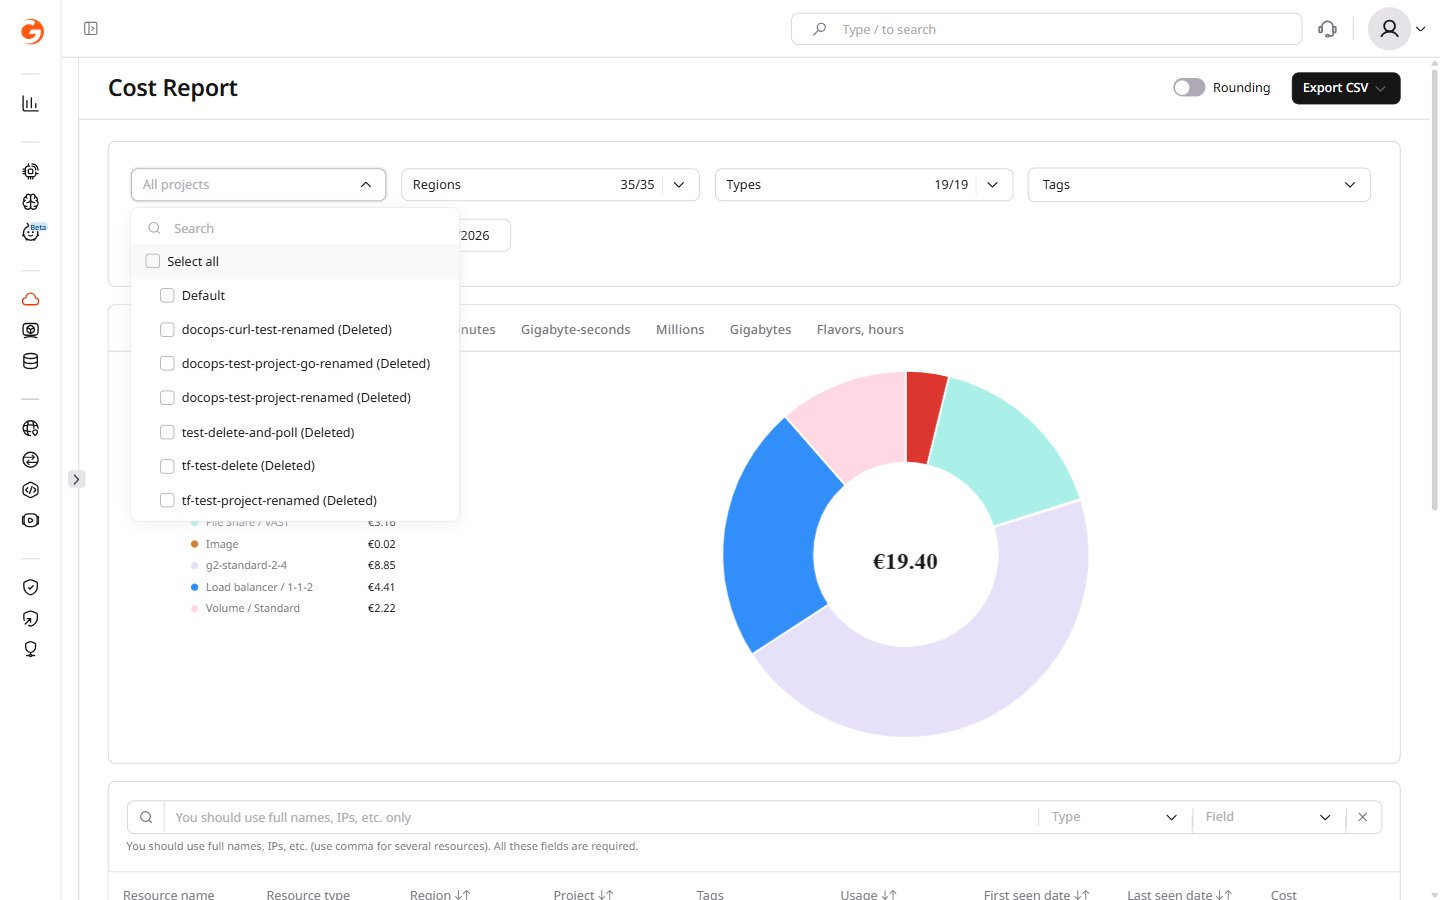
- Project — view costs for all projects or a selected subset. Deleted projects appear in the Project dropdown with a (Deleted) label and can be selected like active ones.
- Regions — filter by the region where resources were created.
- Types — filter by resource type.
- Tags — filter by tags assigned to resources.
- Consumption period — view costs for 1 week, 2 weeks, or a custom date range. The maximum custom period is one month.
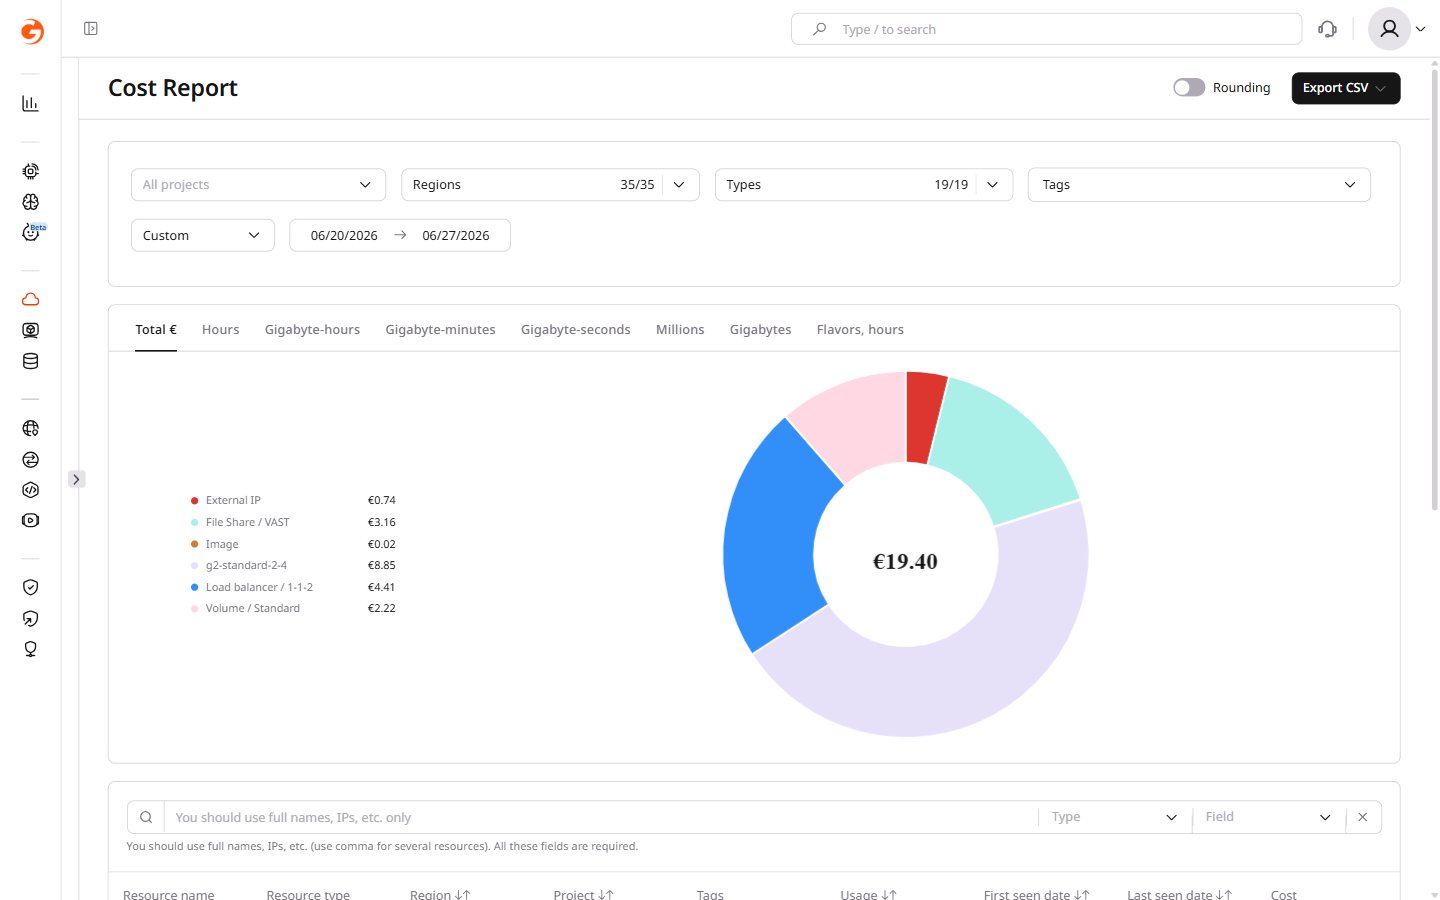
- Hours
- Gigabyte-hours
- Gigabyte-minutes
- Gigabyte-seconds
- Millions
- Gigabytes
- Flavors, hours
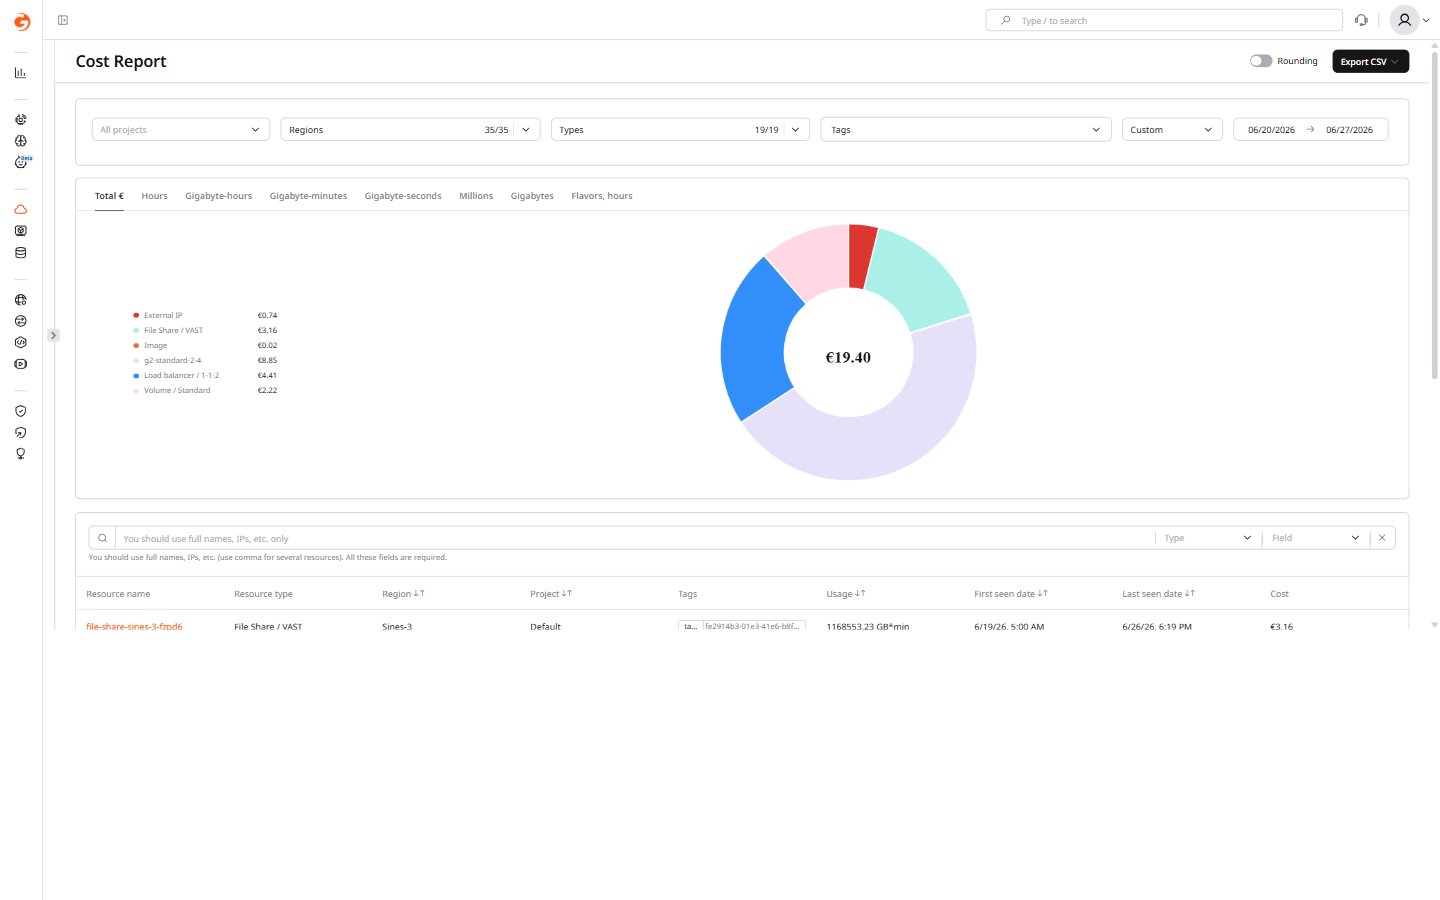
- Resource name
- Resource type
- Region
- Project
- Tags
- Usage
- First seen date
- Last seen date
- Cost
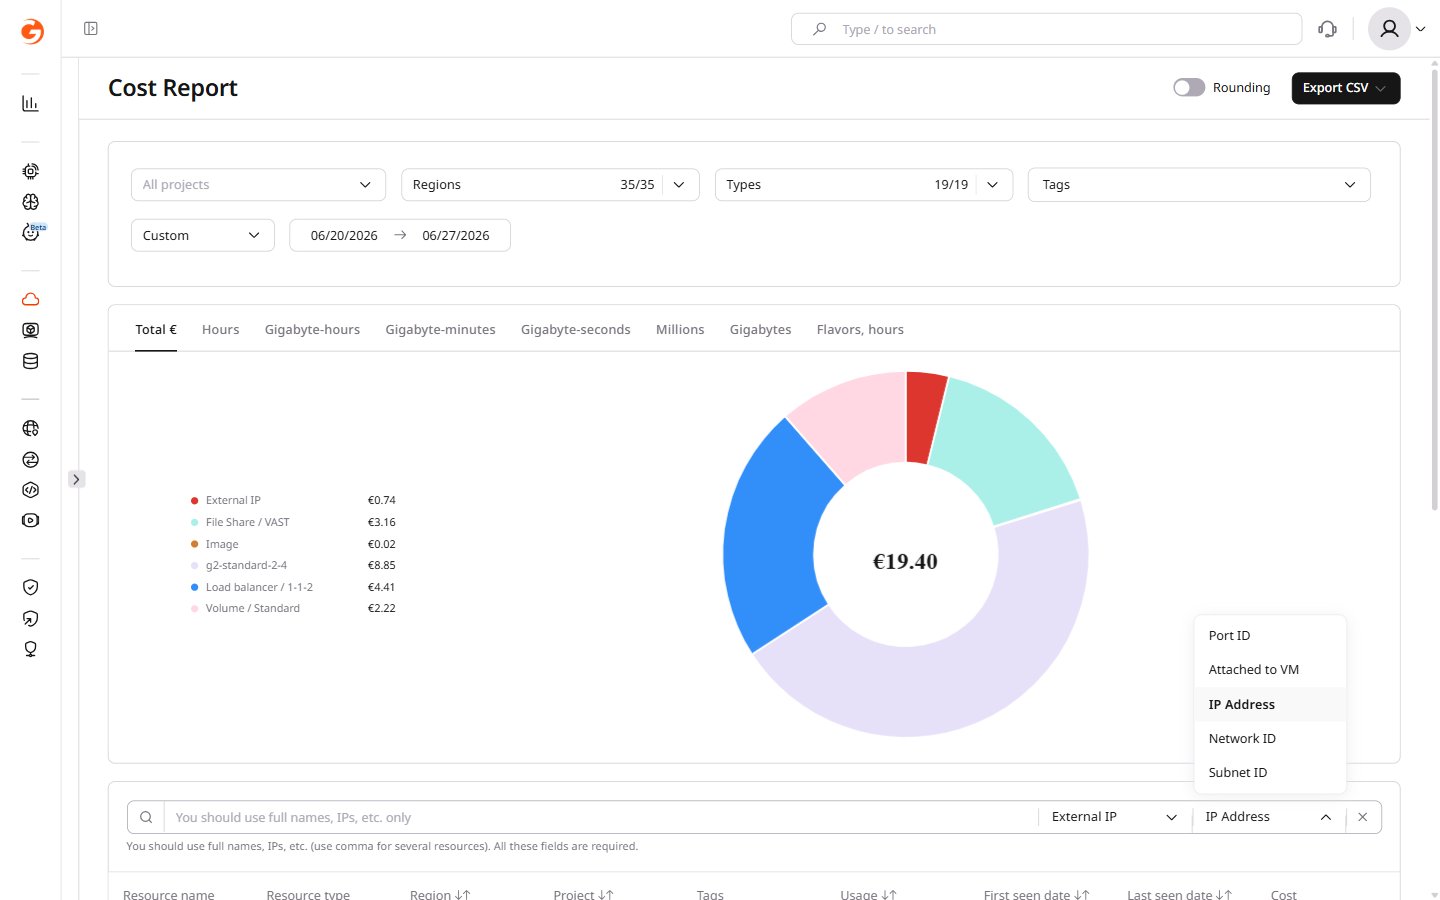
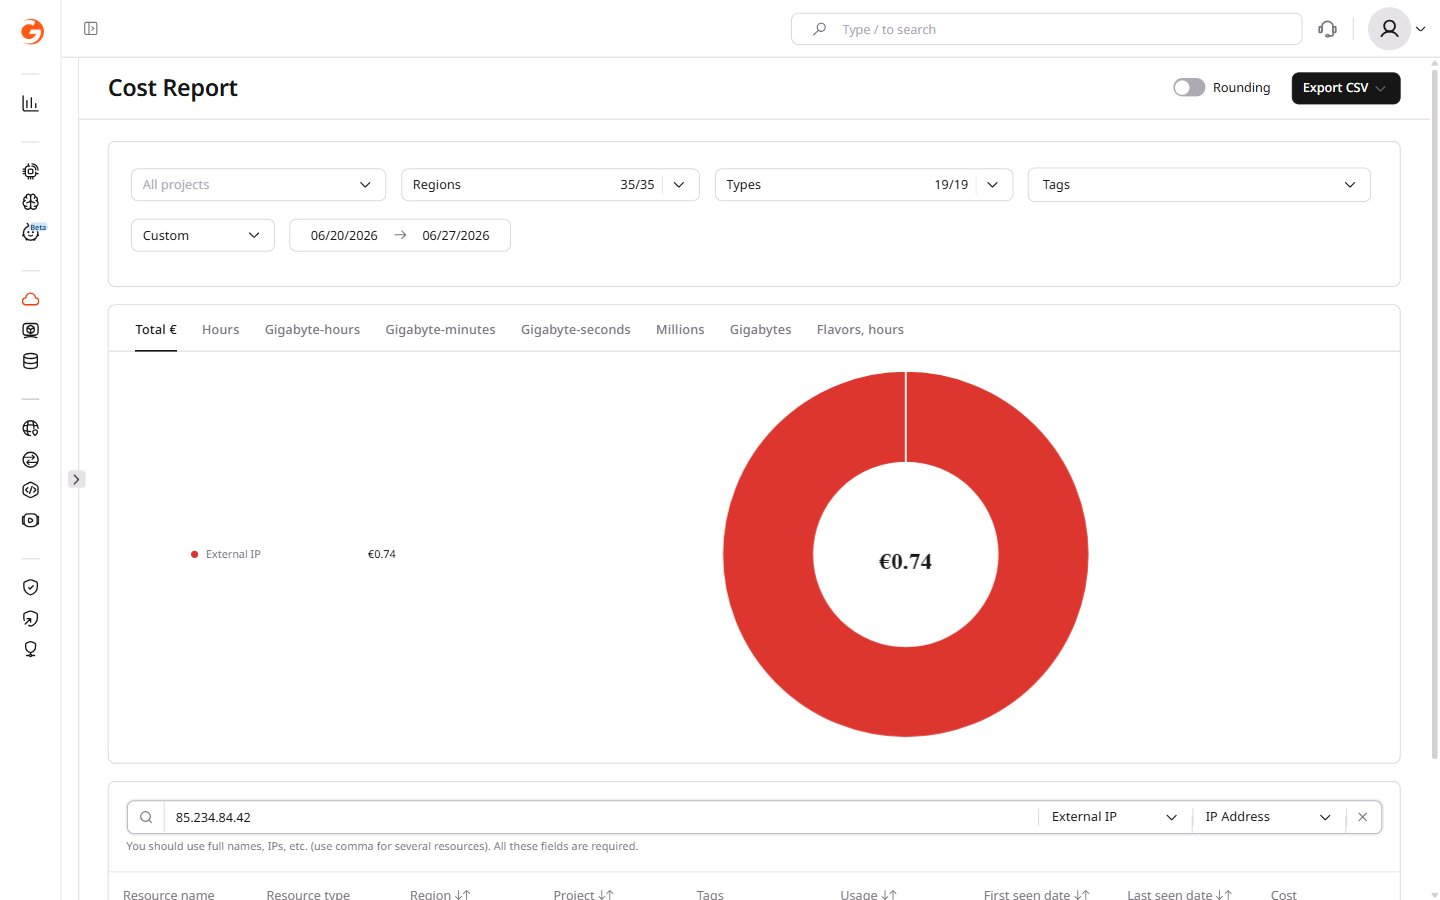
Cost Report export
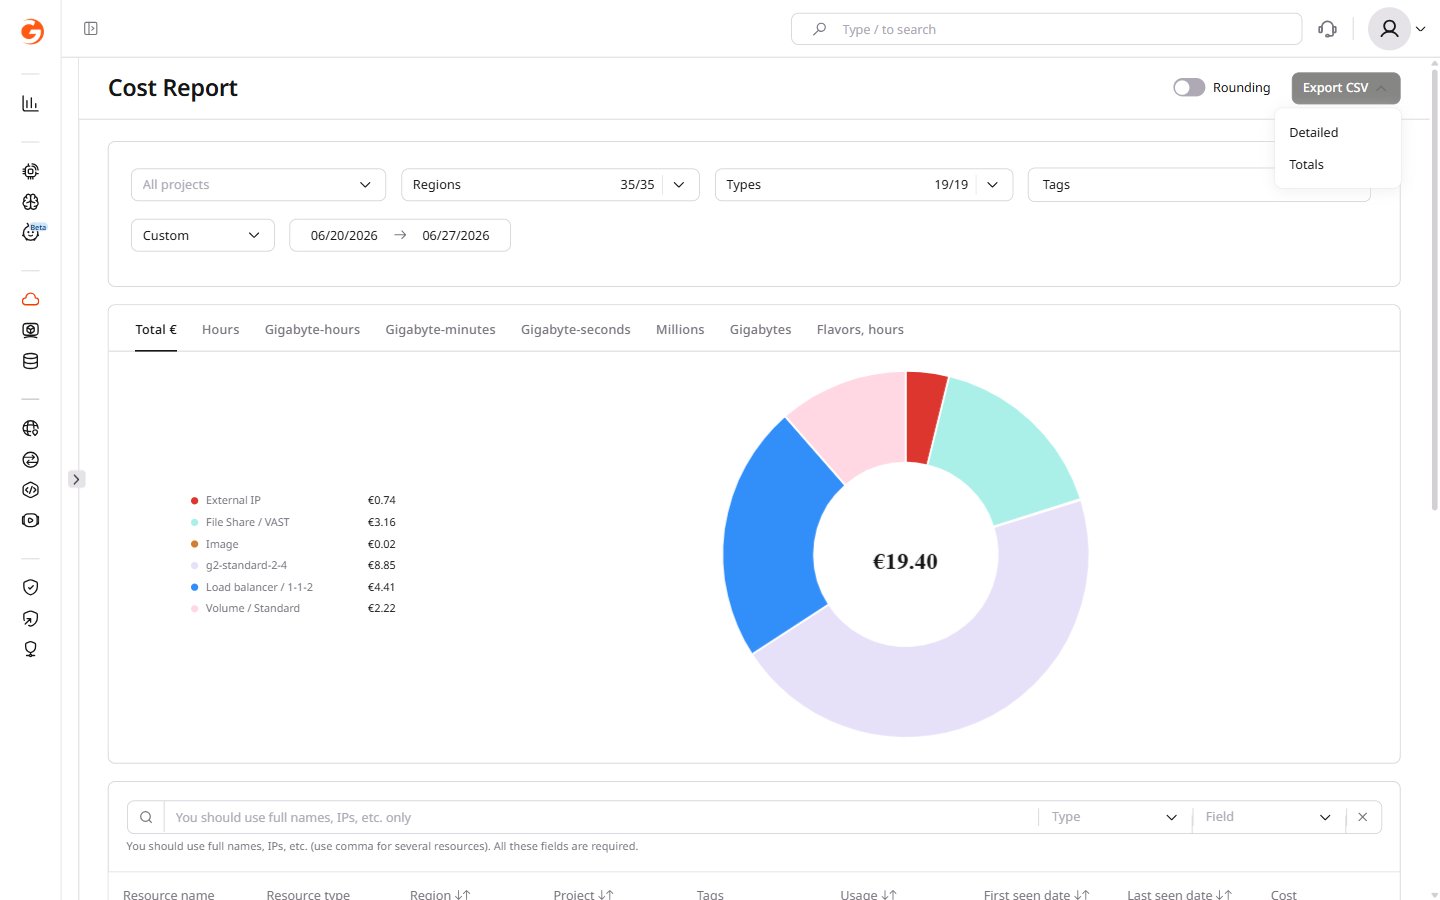
To export data for the selected period, click Export CSV in the top-right corner. Two file types are available:- Detailed — a detailed breakdown of each resource.
- Totals — the total cost of resources in each location.
- Detailed CSV report
- Totals CSV report
The following table describes the columns in the Detailed CSV export.
Reservation Cost Report
The Reservation Cost Report presents monthly usage and costs for prepaid and reserved resources, showing commit utilization and any overcommit charges. Data is grouped by resource type and feature. The cost data can be filtered by:- Regions — filter by the region where resources were created.
- Types — filter by resource type.
- Consumption period — select a specific month.
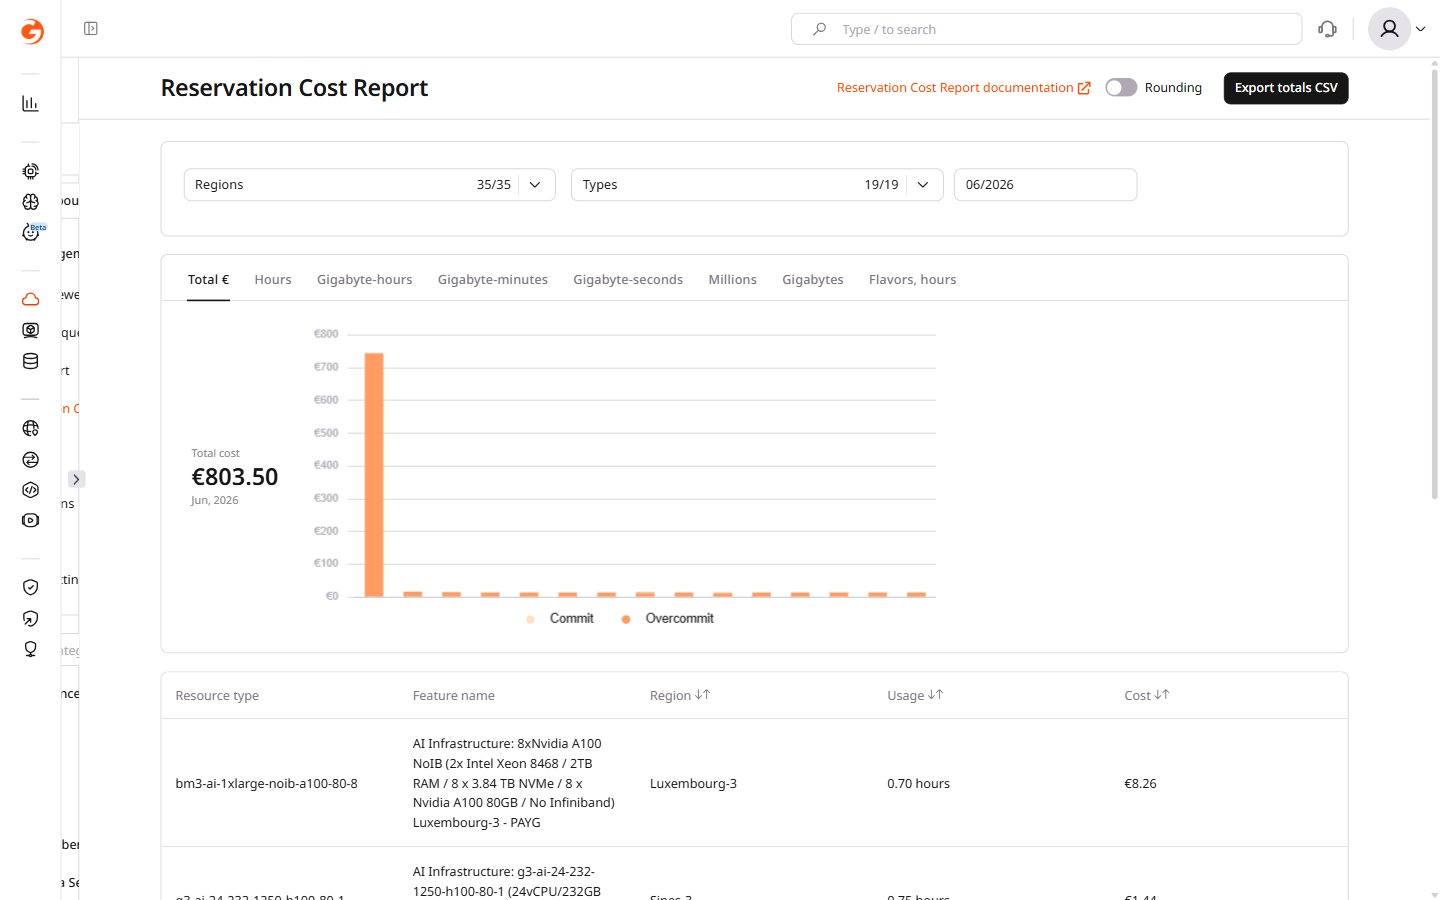
- Hours
- Gigabyte-hours
- Gigabyte-minutes
- Gigabyte-seconds
- Millions
- Gigabytes
- Flavors, hours
- Resource type — the type of Cloud resource.
- Feature name — the billing identifier that combines resource type, configuration, region, and pricing model.
- Region — the region where the resource is located.
- Usage — the amount of resource consumed.
- Cost — the cost for the selected period.
Reservation Cost Report export
To export the billing report for the selected period, click Export totals CSV in the top-right corner.